1 Introduction: The Case for an Incoming Little Ice Age
The climate is cooling, weakening solar cycles 24–25 echo the pre-Maunder pattern, and a public-facing precautionary case is overdue.
1.1 A Climate That Has Always Changed
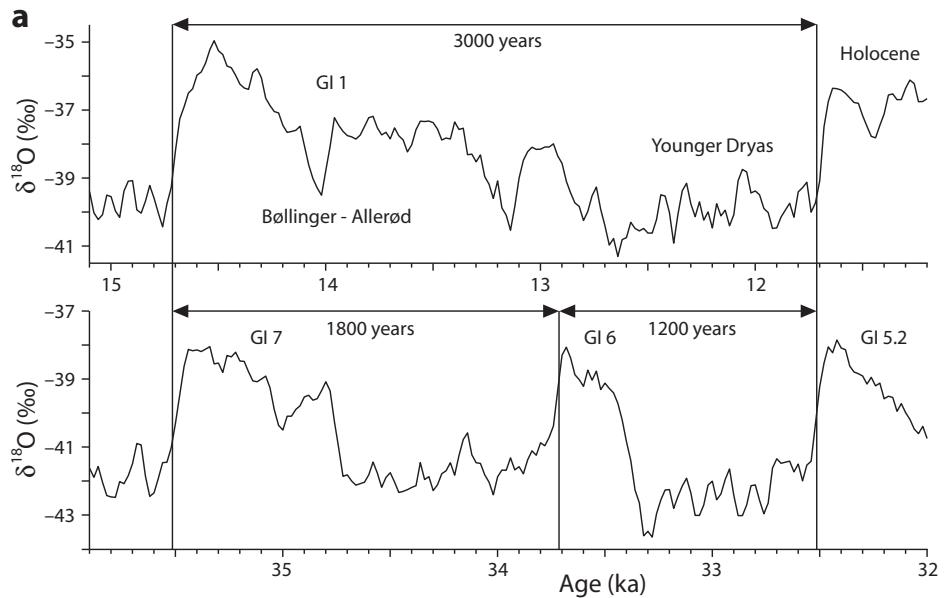
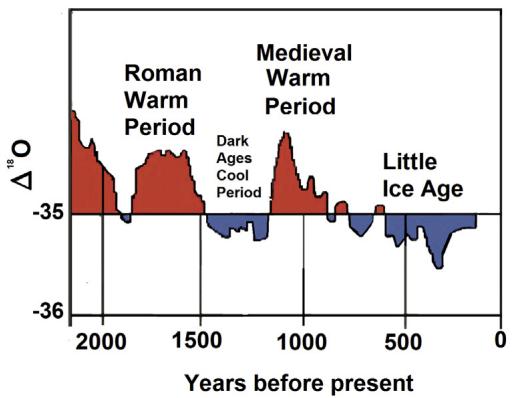
To understand the current trajectory, we must first recognize that change is the norm, not the exception, across the Holocene epoch. [1] The Greenland Ice Sheet Project 2 (GISP2) — an American deep-drilling campaign that recovered a continuous ice core from the summit of the Greenland ice sheet, whose annual layers preserve a year-by-year archive of past climate — provides a critical window into this past, having taken five years and over 3 km of drilling to reach bedrock in 1993. [1] Analysis of Dansgaard–Oeschger (D–O) events — abrupt warmings of the last glacial period in which Greenland temperatures leapt by roughly 8–16 °C within decades before gradually cooling again — in the GISP2 ice core led to the discovery that they displayed a prominent frequency at 1470 years, a periodicity that Stefan Rahmstorf argued had less than 1% probability of being due to chance. [1] While the result was not so clear in similar ice cores like the European GRIP (Greenland Ice Core Project) completed in 1992, GISP2 was considered to have better resolution. [1] The GISP2 record of \(\delta^{18}O\) serves as a proxy for Greenland temperature and has been placed on the new GICC05 timescale. [1] Dividing the 48–10 kyr BP period in boxes of approximately 1500 years helps display the periodicity of the D–O cycle, with the abrupt start of the Holocene in the North Atlantic considered the most recent D–O warming. [1] A new reconstruction of temperature variability in the extratropical Northern Hemisphere during the last two millennia, utilizing many palaeotemperature proxy records never previously included in any large-scale temperature reconstruction, shows a distinct Roman Warm Period c. [2] AD 800–1300. This reconstruction demonstrates that decadal mean temperatures seem to have reached or exceeded the 1961–1990 mean temperature level during substantial parts of these earlier warm periods. [2] During the Medieval Climate Anomaly, spanning the 10th to 13th centuries CE, temperature and hydrological shifts were not uniform. [3] Peatland water-table reconstructions from the North Atlantic Region show that the onset of drier conditions varied temporally and spatially, with some sites recording contradictory hydrological conditions despite their proximity. [4] This high degree of spatial variability suggests that the Medieval Climate Anomaly was characterized by strong regional differences rather than uniform global warmth. Furthermore, global temperature composites indicate that peak Northern Hemisphere warmth during the Middle Ages was less than or at most comparable to the mid-20th-century warm period, as Medieval temperature peaks were not synchronous in all records. [5][6][4][1] The inherent ambiguities in defining this feature underscore the complexity of paleoclimate data. [1] Specifically, the Neoglacial cooling trend averaged approximately -0.2 °C per millennium, a rate that demonstrates the profound impact of even modest temperature changes on global systems. This gradual cooling, which culminated in the Little Ice Age, caused considerable glacier expansion and biome changes, such as the reduction of tropical forests and the expansion of tundra. [1] While short-term fluctuations of 0.4 °C can occur over just a few years, they are transient compared to these millennial-scale trends. [1] Understanding this deep historical context is crucial, as it challenges the assumption that recent warming is entirely anomalous. [1]
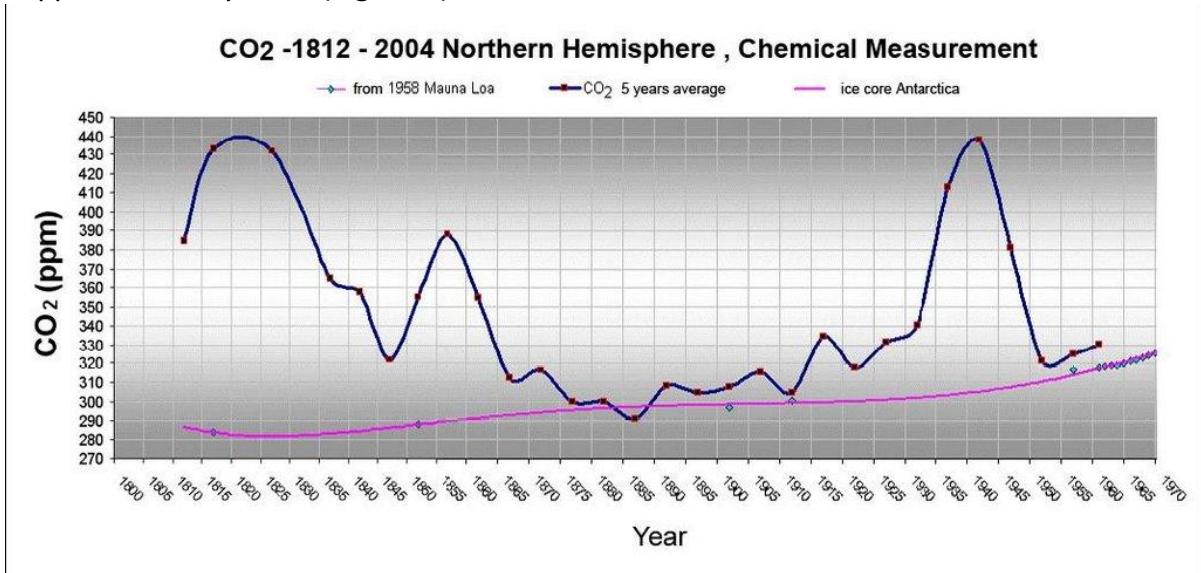
The prevailing narrative often frames climate change as a singular, unprecedented crisis driven solely by modern industrial activity, yet this view overlooks the deep historical context of Earth’s natural variability. [1] As Freeman Dyson noted, climate change is part of the normal order of things, a process that was already occurring before humans came. This intrinsic variability demonstrates that the climate system has always changed, establishing a baseline of natural fluctuation that predates the current era of concern. [1] Recognizing that climate change has always happened allows us to properly understand the totality of climate change, moving beyond a narrow focus on emissions to consider the profound effect of natural climate cycles and events that have shaped the planet’s past. [1] This broader perspective is essential for addressing the unanswered questions in natural climate change that are usually restricted to highly specialized scientific works. [1] While the Intergovernmental Panel on Climate Change (IPCC) presents a specific view of the past 10,000 years, some researchers argue that this depiction of temperature history is selective and incorrect. This contention arises from discrepancies between official records and independent data analyses. [7][1] For instance, critiques suggest that the IPCC’s temperature history is contradicted by the actual data record, pointing to figures that reveal a more nuanced picture than the “approved” storybook narrative implies. [7] The reliance on smoothed global proxy reconstructions, which depend heavily on researcher choices and limited low-precision proxies, introduces significant uncertainty. [1] Consequently, alternative reconstructions, such as those correcting for proxy re-dating and smoothing issues, present a different trajectory. This evidence supports the view that the standard IPCC depiction may be flawed, suggesting that our understanding of past climate stability requires revision. [8] While the Mauna Loa series is frequently cited as the gold standard for pristine measurements, significant disputes exist concerning the accuracy of broader atmospheric CO2 records and the true significance of human emissions over the past 150 years. Critics argue that the objections raised against ice-core data are mysteriously not applied to surface temperature measurements, creating an asymmetry in scientific scrutiny. [9][7][10][1]
1.2 Why Now Weakening Cycles 24 and 25
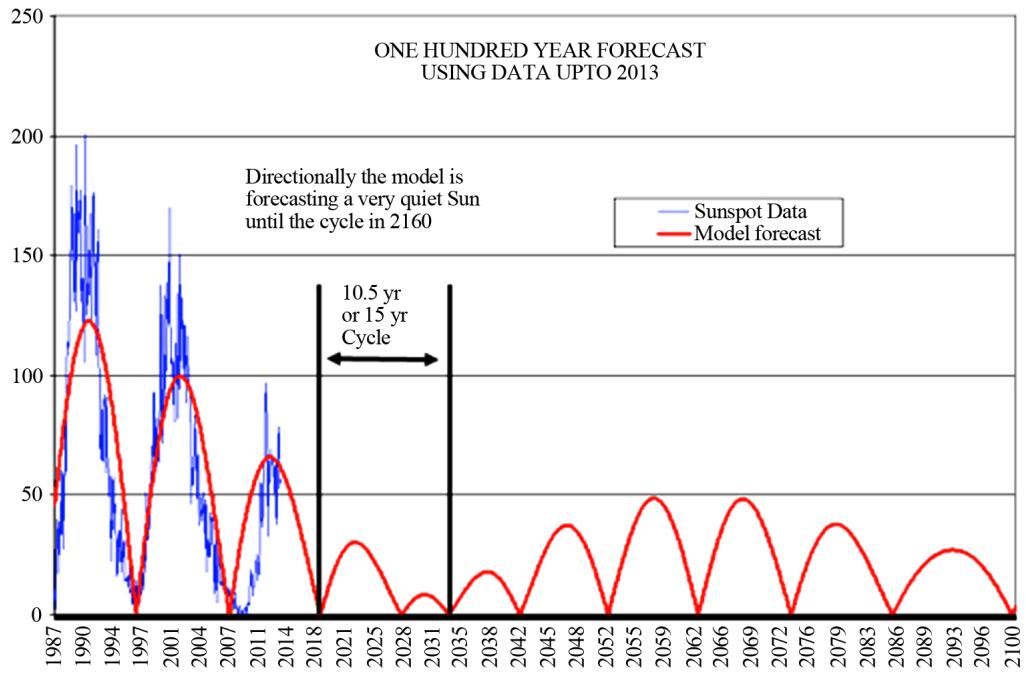
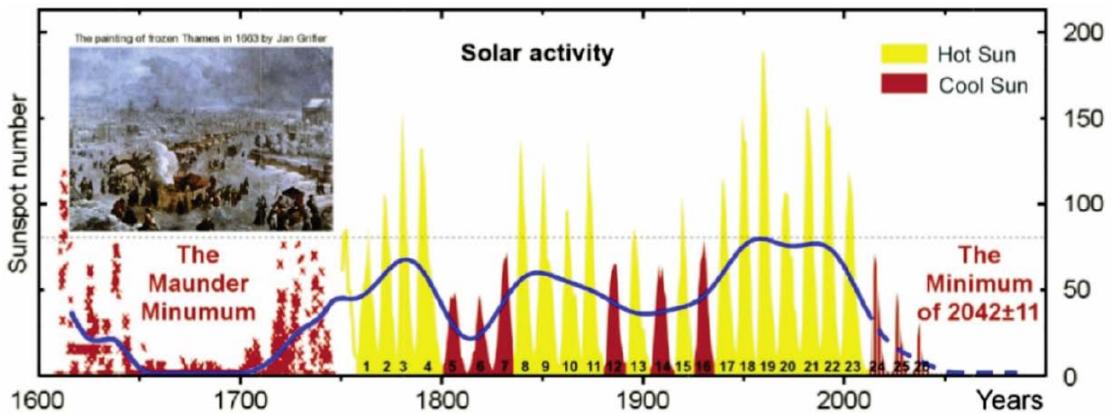
The Sun’s magnetic activity waxes and wanes in a roughly 11-year rhythm known as the solar cycle, tracked most directly in the rise and fall of sunspot numbers; astronomers have numbered these cycles consecutively since 1755. Solar cycle 24 exhibited lower intensity than cycle 23, and forecasters across the solar-minimum literature projected that cycle 25 would be weaker still. This decline is not merely a fluctuation in sunspot counts but reflects a substantial weakening of the Sun’s magnetic field, as evidenced by a 51% reduction in integrated solar magnetic energy density from cycle 23 to cycle 24. [11][12][13] Furthermore, the solar wind Alfven speeds — the characteristic speed at which magnetic disturbances propagate through the solar wind plasma — dropped below 57 km/s, a marked decrease from the range observed in cycles 22 and 23, while the solar wind magnetosonic Mach number showed a larger lower bound for cycle 24 compared to its predecessors. These changes have weakened the energy coupling parameter, leading to a substantial 15%–38% decrease in the average strength of high-latitude ionospheric, low-latitude magnetospheric, and equatorial ionospheric current systems. [12] Consequently, high-latitude Joule heating manifested a reduction of approximately 30% during cycle 24. This alignment supports the prediction of a modern grand solar minimum spanning from 2020 to 2053. [14] As we move deeper into this predicted quiet period, the data suggests that the Sun is entering a phase of diminished output that could have important implications for our Earth’s atmosphere-ionosphere-magnetosphere system. [15]
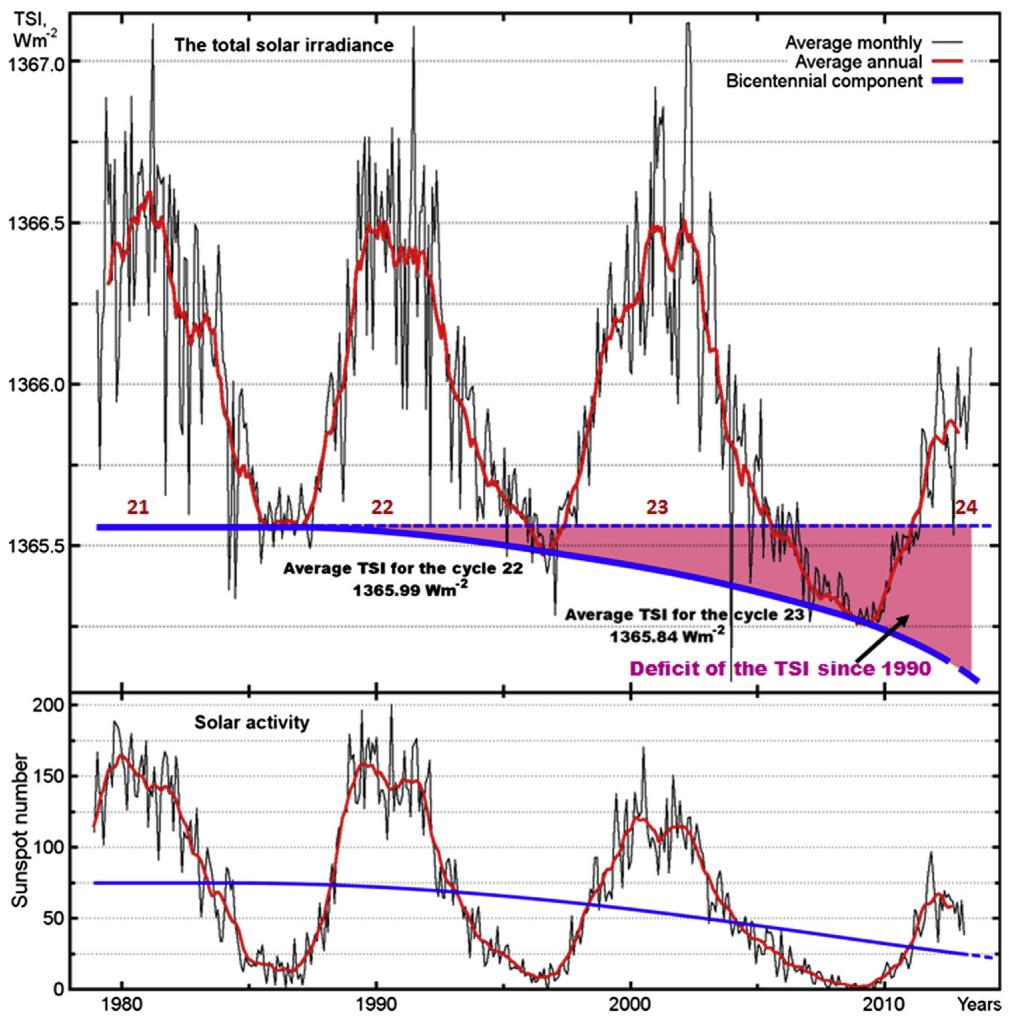
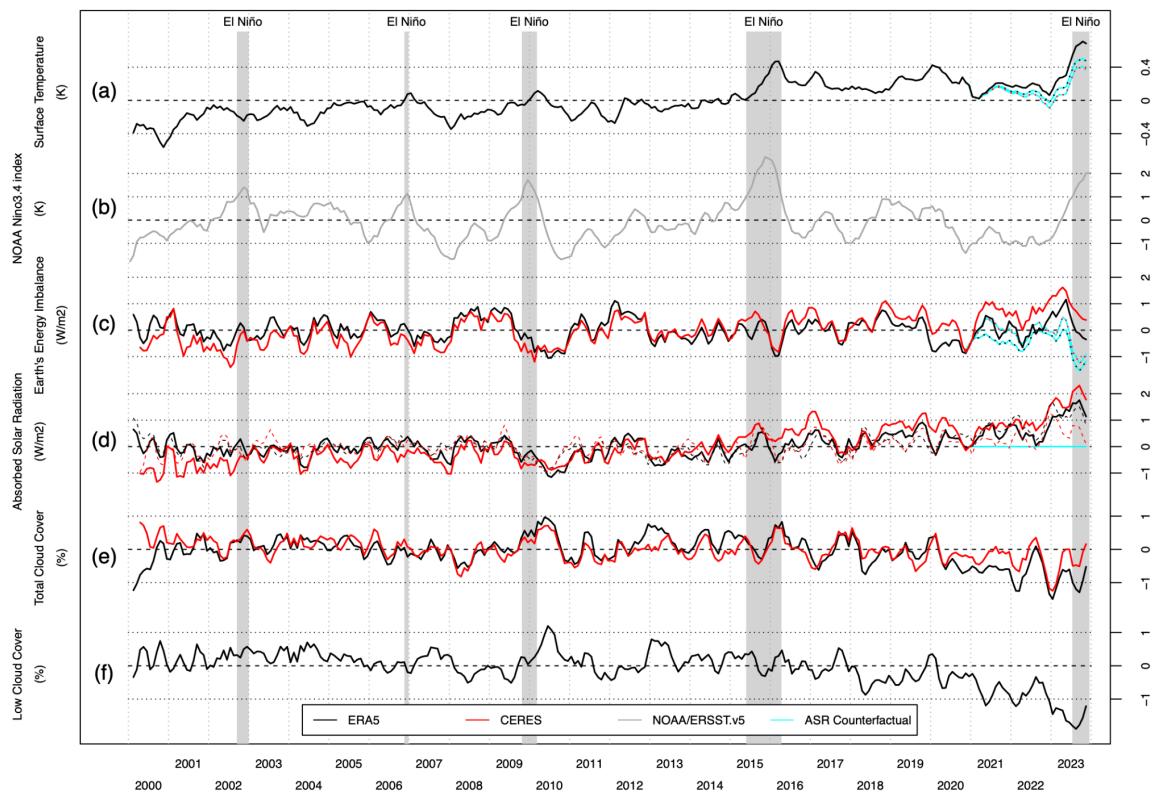
The Sun’s energy output is not static; it fluctuates with the solar cycle, and recent data reveals a troubling trend. [16] Total Solar Irradiance (TSI), the measure of solar energy reaching Earth, has shown an increasing rate of decline from cycle 22 through cycle 24, continuing into cycle 25. This acceleration is stark: the average annual decrease rate in the 22nd cycle was approximately 0.007 Wm⁻²/yr, rising to ~0.02 Wm⁻²/yr in the 23rd cycle. [16][12] In the current cycle, this rate has jumped to almost 0.1 Wm⁻²/yr, a trajectory that is consistent with a deepening solar dimming. [16] The 11-year component of TSI in the current cycle has decreased by almost 0.7 Wm⁻² with respect to cycle 23, while the average cyclical values were lower by ~0.15 Wm⁻² in the 23rd cycle than in the 22nd. [16] Furthermore, the TSI value at the minimum between cycles 23 and 24 was lower by ~0.23 Wm⁻² compared to the 22/23 minimum. This observed trend of increasing TSI decline suggests that the current solar behavior mirrors the analogous TSI decline of the Maunder Minimum period, setting the stage for a new era of reduced solar heating. [16] This level was \(0.32 \, W/m^{2}\) lower than the minimum of the 21st cycle in October 1986 and \(0.25 \, W/m^{2}\) lower than the 22nd cycle minimum in June 1996. [17] The value of TSI at the minimum between 23/24 cycles (\(1365.27 \pm 0.02 \, Wm^{-2}\)) was lower by ~0.23 and ~0.30 \(Wm^{-2}\) than at the minima between 22/23 and 21/22 cycles, respectively. [16] This confirms that the TSI minimum between cycles 23 and 24 was lower than the minima between cycles 21/22 and 22/23. This finding suggests that the solar irradiance during this specific minimum was indeed anomalously low compared to recent historical precedents. [18][16][17][19][20] This decline is consistent with analyses of the solar background magnetic field derived from WSO magnetic synoptic maps, which indicated that cycle 25 would exhibit smaller activity compared to cycle 24. [11] Such findings align with the prediction of a modern grand solar minimum spanning 2020 to 2053. [14] Furthermore, predictions based on the Layman’s Sunspot Count, which utilizes SIDC values while ignoring specks rated lower than 23 pixels, indicated that cycles 24 and 25 would remain below 50 SSN. This approach quantifies AMP events to provide a platform for future sunspot prediction out to 3000 AD. [21] The current AMP group, which began with solar cycle 20, failed to generate a full grand minimum due to a weak AMP event caused by the late timing of the Uranus/Neptune conjunction and a failed Wilson’s Test. [21] The results indicate that a solar minimum is in progress during cycle 24, with Cycle 24 being smaller than Cycle 23 and — in that projection — Cycle 25 smaller than Cycle 24. [22] This pattern suggests continued weakness through cycle 27, around 2050, consistent with a Dalton-type solar minimum. The expected intensity of this prolonged low-activity period is similar to that of the Dalton Minimum, reinforcing the view that the current solar behavior marks a significant departure from the stronger cycles of the mid-twentieth century. [22][23] By classifying solar Cycle 24 as moderate or low based on the negative power anomaly and the negative phase of the 120-year solar magnetic pattern, these models supported the conclusion that Cycle 25 could not be high. [23] Analysis of the Clouds and the Earth’s Radiant Energy System, Energy Balanced And Filled data (CERES EBAF 2.8) reveals a small but negative trend in the net Top Of Atmosphere (TOA) energy imbalance over the past decade, a finding that contradicts earlier assertions that external radiative forcing was not essential to the climate hiatus. [24] This negative trend in the net radiation is consistent with the decreasing Total Solar Irradiance (TSI), as the incoming solar radiation has decreased due to the approach toward the Centennial Gleissberg Cycle (CGC) minimum, while the Outgoing Longwave Radiation (OLR) has remained largely unchanged owing to the lack of a global temperature trend during the hiatus, and the Reflected Shortwave (RSW) radiation, determined by albedo, did not significantly change. [24] Consequently, over a span of approximately 53 to 75 years, the Earth is projected to maintain a negative average annual energy balance, a state that suggests a sustained cooling phase rather than a temporary fluctuation.
1.3 Ocean Modes Turning Cold AMO and PDO
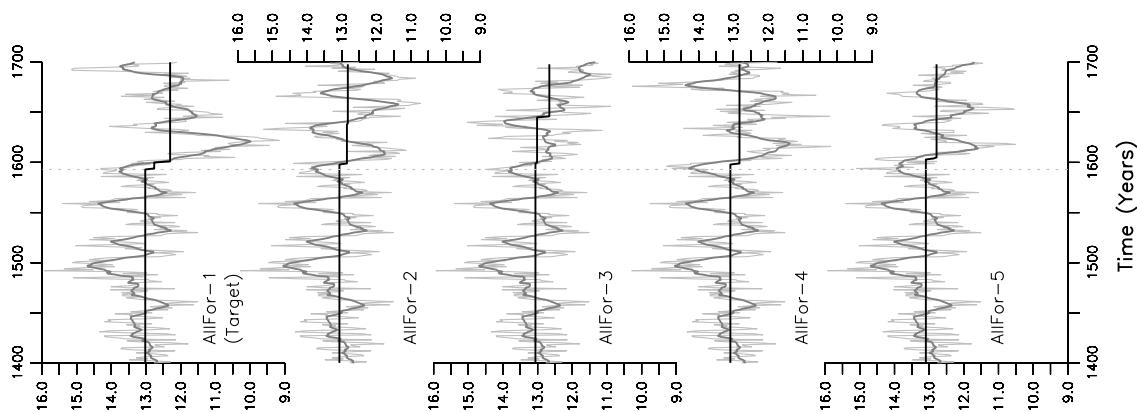
To understand the current trajectory toward a colder climate, we must first examine the internal dynamics of the Atlantic and Pacific basins, where recent shifts suggest a departure from the warm phases that dominated the late twentieth century. [8] Recent simulations using the MPI-ESM-P Earth system model indicate that this system is capable of abrupt, self-sustaining shifts that can lock the region into prolonged cold states. Specifically, an ensemble of millennium-long simulations reveals that an abrupt weakening of the subpolar gyre — the counterclockwise loop of cold surface currents circulating the North Atlantic south of Greenland and Iceland — can trigger multicentennial cold climate regimes resembling the Little Ice Age. This mechanism does not rely on a permanent collapse of the broader overturning circulation but rather on localized feedbacks involving sea ice and freshwater export. [26][27] This weakening was driven by anomalous freshening in the upper Labrador Sea and cold conditions in the Nordic Seas, which enhanced sea ice growth and export through the Denmark Strait. [26] The resulting reduction in poleward heat transport cooled the Nordic Seas further, creating a positive feedback loop that stabilized the weaker gyre regime. [26] The simulated post-shift climate featured expanded sea ice, reduced subpolar meridional heat transport, and persistent blocking-like sea level pressure anomalies, conditions that broadly agree in magnitude and duration with paleoclimate reconstructions of the Little Ice Age. While the timing of the simulated shift around 1600 CE differs from reconstructed anomalies in the thirteenth and fourteenth centuries, this discrepancy is attributed to the dominance of internal climate variability rather than a failure of the mechanism. [26] Simulations from the MPI-ESM-P model, specifically the Past1000-R3 ensemble, provide a mechanistic understanding of how such cold regimes stabilize. In this simulation, an abrupt weakening of the subpolar gyre around 1600 separates two stationary regimes, with the post-shift cold regime persisting for at least 250 years. [26] First, reduced poleward heat transport cools the Nordic Seas, which enhances sea ice growth and export through the Denmark Strait, further freshening the Labrador Sea. [26] Second, reduced salt transport sustains this upper-ocean freshening. [26] These feedbacks demonstrate that the post-shift cold regime is stabilized by interactions between freshened upper Labrador Sea waters and expanded sea ice. Although the Atlantic Meridional Overturning Circulation (AMOC) does not exhibit a long-lasting shift, it temporarily weakens during the transition, contributing to the broader cooling signal. [27] In one specific millennium-long simulation (Past1000-R3), the SPG weakened by 0.72 Sv over two decades around 1600, separating two stationary regimes with the post-shift state persisting for at least 250 years. [26] Two positive feedbacks stabilized this weaker regime: reduced poleward heat transport cooled the Nordic Seas, enhancing sea ice growth and export through the Denmark Strait, which further freshened the Labrador Sea; simultaneously, reduced salt transport sustained upper-ocean freshening. [26] Crucially, while the AMOC temporarily weakened during the transition, the simulations establish that these abrupt subpolar gyre shifts are not associated with persistent changes in Atlantic Meridional Overturning Circulation strength. The simulated post-shift climate featured expanded sea ice, reduced subpolar meridional heat transport, and persistent blocking-like sea level pressure anomalies, broadly agreeing in magnitude and duration with paleoclimate reconstructions of the Little Ice Age. [28][26] Historical analogs provide a stark warning about the potential magnitude of such shifts. [1] The model simulations show that a rapid weakening of the subpolar gyre, driven by freshwater export from the Arctic and associated freshening in the upper Labrador Sea, can initiate a cascade of anomalous oceanic and atmospheric circulation, sea ice extent, and upper-ocean salinity changes. [26] The discrepancies in timing are not a flaw in the model but rather a reflection of the chaotic nature of internal climate variability. [26] As the research indicates, preconditioning by internal variability explains the timing discrepancies between simulated subpolar gyre shifts and reconstructed Little Ice Age onset. This finding is pivotal because it demonstrates that the ocean can spontaneously enter a cold state due to its own internal dynamics, without requiring a persistent external forcing like a grand solar minimum. [26] The ocean is not just a passive recipient of solar energy; it is an active participant in the climate system, capable of storing and releasing heat in ways that can override short-term atmospheric trends. [29]
1.4 Echoes of the Pre Maunder Configuration
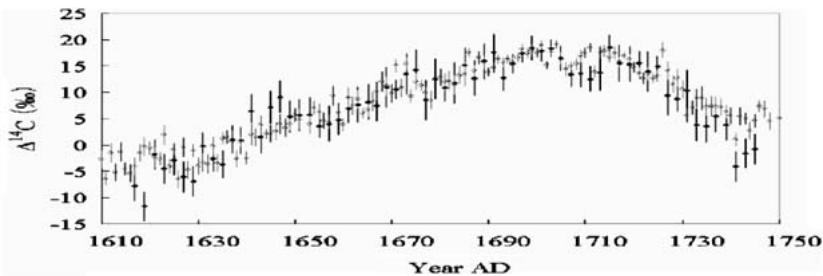
To understand the current solar trajectory, we must first look to the historical baseline established by the Maunder Minimum, a period spanning from 1645 to 1715 that serves as a primary analogue for contemporary solar behavior. [30] The Maunder Minimum (1645–1715) was a period of low sunspot numbers and reduced total solar irradiance. During this time, the sun entered a state of prolonged quietude, with observations from the mid-seventeenth century noting a significant decline in the frequency and intensity of these solar features. [31][32][33][34][35][36] These isotopic records show a distinct maximum during the Maunder Minimum, indicating that the sun’s magnetic field was too weak to deflect cosmic rays effectively, a signature of low solar activity. [37] The Maunder Minimum demonstrates that the sun can enter extended periods of low activity, with significant consequences for global climate. [38]
The Maunder Minimum (approximately 1645–1715) serves as a critical historical baseline for understanding the climatic consequences of prolonged solar hibernation. [38] During this epoch, European temperatures plummeted, shortening the growing season by more than a month. This cooling was not merely a statistical anomaly but a tangible crisis that reshaped daily life and agricultural viability across the continent. [39] In the Paris region, the average monthly temperature fell below freezing eight times between 1691 and 1697, a phenomenon never again seen. [39] Further north, in Finland, long winters and early night frosts destroyed the harvest in both 1695 and 1696, causing a demographic catastrophe with population losses in some areas exceeding 40 per cent. [39] The natural archive on climate indicates that average temperatures in 1687–1700 were 1.5°C lower than in the preceding decade, leading climatologists to christen this period the climax of the Little Ice Age. [39] These oscillations, though seemingly small, had outsized impacts: since each change of 0.1°C in global temperature advances or retards the ripening of crops by one day, the cooling of the 1690s delayed harvests by an average of two weeks in temperate zones. [39] During this era, severe cold caused the Thames River and Dutch canals to freeze over, demonstrating the tangible impact of solar quiescence on regional hydrology. [8] The northern hemisphere experienced a landmark winter in 1657–58, where the canal between Haarlem and Leiden remained frozen for two months, and the Baltic froze so hard that the Swedish army marched over ice to launch a surprise attack on Copenhagen. [39] John Evelyn judged that he and his compatriots had just lived through ‘the severest winter that man alive had known in England,’ with crow’s feet frozen to their prey. [39] Later, during the Great Frost of 1683–84, the River Thames was completely frozen for two months, with ice reaching 11 inches thick at London. [40] Solid ice extended for miles off the coasts of the southern North Sea, preventing the use of many harbors and causing severe problems for shipping. [40]
The historical record confirms that cereal grain harvest failures during the Maunder Minimum led to mass famines in Europe. This catastrophic outcome was driven by a global fall in temperature of \(1^{\circ}\) C to \(2^{\circ}\) C, caused by abnormally low solar activity in the early and mid-seventeenth century combined with major volcanic eruptions. [41][42][39] A single degree centigrade was enough to have a serious effect on growing seasons, leading to catastrophic falls in crop yields across the world. [39] In seventeenth-century Europe, a 30 percent reduction in the grain harvest often doubled the price of bread, whereas a 50 percent reduction quintupled it. [42] The most densely populated areas of the early modern world relied on a single crop: wheat or rye in Europe, rice in Asia, and maize in the Americas. [42] These staple crops constituted up to 75 percent of the population’s diet, making these dynamics devastating. [39] The widespread food crises of the seventeenth century, and especially the crisis of the 1690s, have been connected to a period of low solar activity, to the Maunder Minimum (c. [43] 1645–1715). Thus, although low solar activity is likely to have contributed to the cooling conditions of the seventeenth century over the long time scale, the sudden drop in summer temperatures and resultant crop failure years across northern Eurasia resemble the signature of volcanic eruptions more than the signal of solar activity. The case of seventeenth-century Southern Ostrobothnia demonstrates that this forcing can fundamentally challenge human lives more than ten thousand kilometres away from the physical source of the eruption. [41]
The late seventeenth century serves as a critical baseline analogue for understanding current solar behavior, particularly the period known as the Maunder Minimum (approximately 1645-1715). [38] Such dramatic reductions, extending beyond a single eleven-year cycle, are classified as grand solar minima. [44] During these periods, the Sun exhibits specific physical traits that distinguish it from active phases. [45]
The historical record provides a critical baseline for understanding the potential climatic consequences of prolonged solar quiescence, particularly when examining the Maunder Minimum period that spanned approximately 1645 to 1715. [38] This era is widely regarded as the most prominent recent instance of reduced solar activity, characterized by a distinct lack of visible sunspots as documented by Eddy 1976, alongside increased concentrations of cosmogenic isotopes such as carbon-14 and beryllium-10 that indicate a more quiescent heliospheric magnetic field. [46] Paleoclimate reconstructions, including tree-ring data from northern North America analyzed by Jacoby and D’Arrigo 1989, reflect the general coldness associated with the Little Ice Age during this seventeenth-century window, suggesting that global or Northern Hemisphere temperatures were approximately 0.5 degrees Celsius colder than today, with extratropical regions experiencing cooling closer to 1 degree Celsius. [46] Even the multiproxy reconstructions of Mann et al. 1999 and Mann et al. 2003, which suggest the hemispheric-average cooling was only a few tenths of a degree, register a discernible cold anomaly during this window.
1.5 Why This Book and How It Argues
This book provides the evidence and the argument for this approach, challenging the current narrative of anthropogenic global warming. [49]
The book asserts that IPCC temperature and CO2 records are selective, inaccurate, or based on discarded data. This critique establishes that the Intergovernmental Panel on Climate Change’s depiction of the temperature history over the past 10,000 years is selective and plain wrong, contradicting the actual data record. [7] Furthermore, serious questions regarding the accuracy of the IPCC’s claimed record of atmospheric CO2 over the past 150 years demonstrate that many measurements have been discarded because they do not agree with the approved story. Additionally, the study identifies significant errors in the IPCC reports, showing that the 39 computer models used by the panel fail validation against measured surface temperature changes. [48]
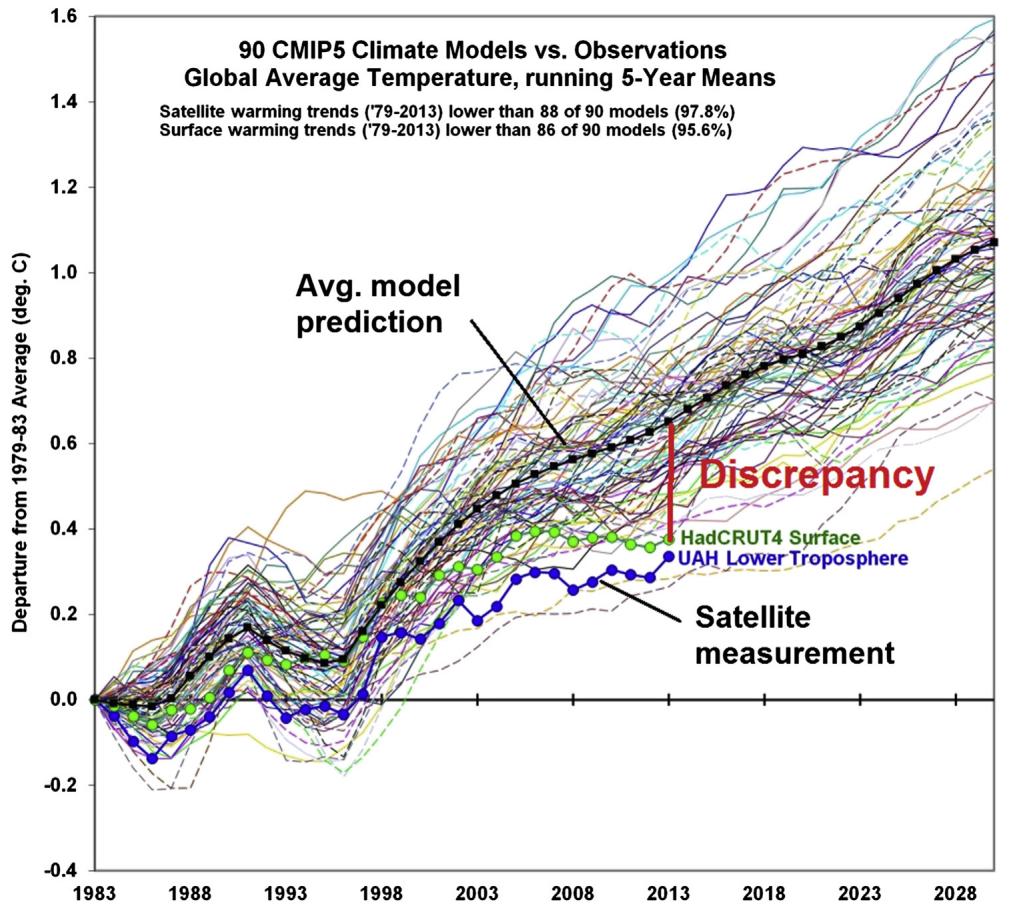
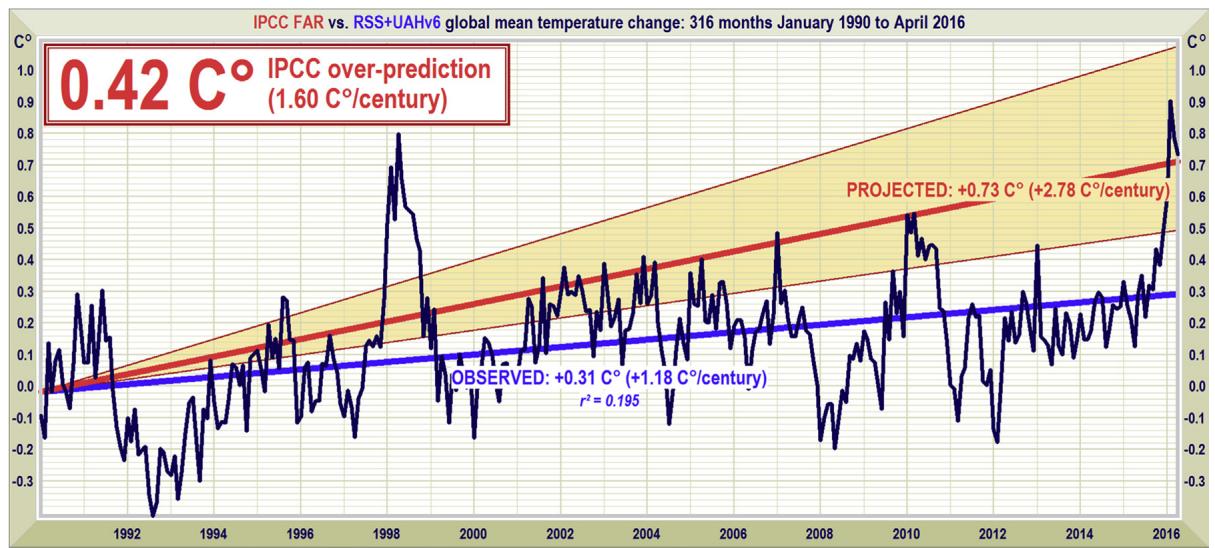
The author posits that solar variability, specifically a ‘hibernation’ or cold spell, is the primary driver of current climate change. This perspective establishes that a historic reduction in the energy output of the Sun has begun, signaling the end of global warming and the start of a new, potentially dangerous cold climate. [49] The evidence demonstrates that this significant climate change event is coming, with the most likely outcome being widespread global loss of life and social, economic, and political disruption. [49] Understanding this shift is essential for preparing for the inevitable cold and difficult years to come. [49] Adaptation involves practical adjustments to clothing, transportation, and the design of homes and businesses, alongside a deeper understanding of cold-weather health hazards. [52] Given that Little Ice Age conditions could strangle food production and trigger famines, the plan emphasizes techniques for long-term food storage. [53] Furthermore, because massive ice storms and blizzards can cause widespread electrical outages that render modern electric heating systems useless, the strategy highlights the critical need for backup heat sources that do not rely on electricity. Consequently, the text demonstrates that individuals and communities must prepare for a scenario where they cannot rely on external aid, whether from their own national governments or from foreign powers. The book’s mission, therefore, is to alert readers to this reality before it becomes an immediate crisis. [49] The narrative emphasizes that staying silent about these discoveries would be a disservice to the public, especially given the potential for a “long depression” or severe economic recession tied to the cooling trend. [49] Thus, the text proves that a shift toward self-reliance is not just advisable but essential for navigating the upcoming decades.
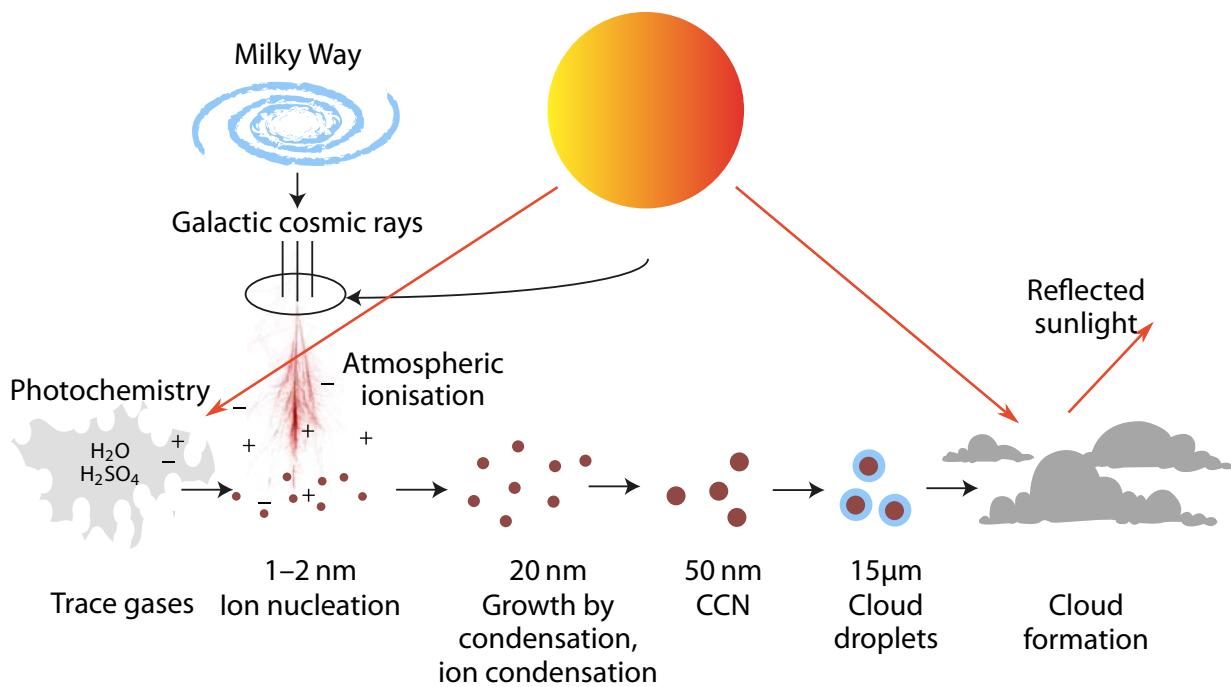
The chapters that follow build the case in sequence. Chapter 2 traces the rhythm of past cold and warm periods, showing that abrupt climate swings are the historical norm rather than the exception. Chapter 3 lays out the tools of solar science — how sunspots are counted and the Sun’s output is measured. Chapter 4 turns to Zharkova’s two-wave dynamo and its forecast of a grand minimum. Chapter 5 follows the Sun’s own motion about the solar system’s centre of mass, the planetary clock behind those cycles. Chapter 6 examines the cloud hypothesis — how cosmic rays, modulated by solar activity, may seed the clouds that cool the Earth. Chapter 7 explores the underground connection between a quiet Sun and a restless crust. Chapter 8 confronts the attribution question head-on, weighing the Sun against carbon dioxide. And Chapter 9 asks what a prudent society should do now to prepare for a colder few decades.